

A 2026 Industry Survey Report
Benchmark data on how automating IT workflows — from ticket triage to self-healing infrastructure — is reshaping operational metrics, cost structures, and team efficiency for MSPs and mid-sized IT organizations.
Executive Summary & Key Findings
AIOps has crossed the threshold from enterprise-only territory into the mid-market. The data from 2025–2026 research surveys, analyst reports, and vendor benchmarks tell a consistent story: organizations that automate IT workflows see measurable, repeatable improvements across every core operational metric.
Headline numbers:
- 40–50% average MTTR reduction with AIOps vs. manual dispatch (Forrester / Research Square, 2025)
- $85 → $2–5 cost per ticket: manual vs. fully automated resolution (Mizo / Lorikeet, 2025–26)
- 80% of outages attributable to human error in manual operations (Enconnex / Uptime Institute, 2025)
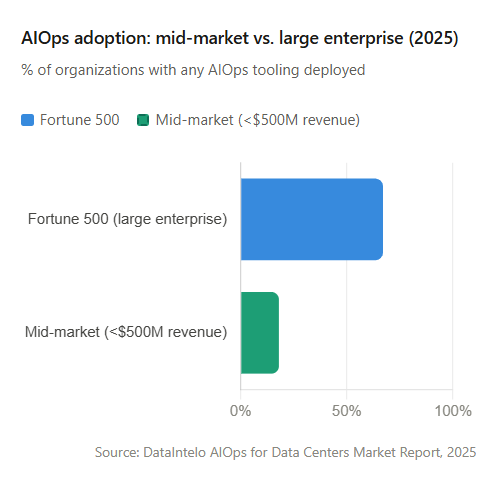
- 18% of mid-market firms have any AIOps tooling deployed, vs. 67% of Fortune 500 (DataIntelo, 2025)
- 300% ROI within 18 months for organizations at AIOps maturity Level 4 (IBM Instana / NeuralWired, 2026)
Report thesis: The mid-market automation gap is the defining IT operations story of 2026. While large enterprises have spent years deploying AIOps, fewer than one in five mid-sized firms has any form of AI-driven IT operations tooling. The cost to remain manual — in MTTR, ticket labor, human error, and downtime — is compounding. This report benchmarks where the savings are, how large they are, and what it takes to close the gap.
Headline findings table:
| Metric | Manual baseline | Automated benchmark | Improvement |
|---|---|---|---|
| Mean Time to Resolve (MTTR) | 2–4 hours average | 18–85 minutes | 40–60% faster |
| Cost per service ticket | $75–$600 (L1–L3) | $0.50–$5 (automated) | Up to 95% lower |
| Human error-related outages | ~40% of orgs hit annually | Significant reduction via runbook enforcement | Reduced 30–50% |
| Alert noise (volume) | Hundreds of raw alerts/day | 80–90% suppressed by correlation | ~85% noise cut |
| Ticket triage accuracy | 77% (manual routing) | 95–99% (AI routing) | +22 percentage points |
| Time to first ticket response | 4–6 hours | Instant (under 2 seconds for AI-handled) | 99% reduction |
| ROI payback period | N/A (cost center) | 9–18 months to full ROI | Proven ROI timeline |
Market Context: AIOps Growth & the Mid-Market Adoption Gap
The AIOps platform market is one of the fastest-growing segments in enterprise software — but growth is heavily concentrated at the top of the market. Mid-sized firms face a window of opportunity before the gap becomes a competitive disadvantage.
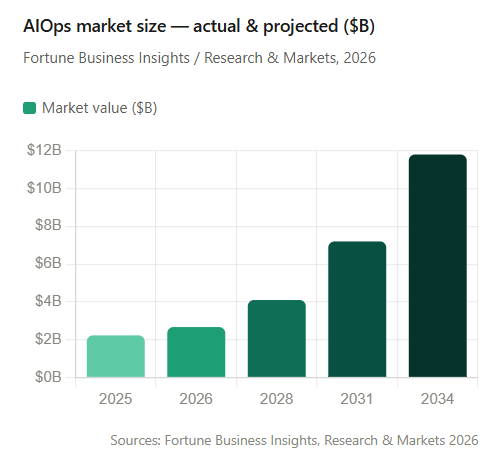
The global AIOps market was valued at $2.67 billion in 2026, growing toward $11.8 billion by 2034 at a 20.4% CAGR (Fortune Business Insights). A separate, broader market definition by Global Growth Insights places the 2025 figure at $24.24 billion when adjacent AI operations tooling is included. Either way, the growth trajectory is steep and consistent across analyst firms.
The critical story for mid-market operators is not market size, but the adoption gap. Only 18% of mid-market enterprises have deployed any form of AIOps tooling, compared to over 67% of Fortune 500 companies. The SME segment of the AIOps market is growing at the fastest CAGR (20.8% through 2034), driven by SaaS delivery models and entry-level pricing below $30,000 annually from vendors such as PagerDuty, BigPanda, and LogicMonitor.
Market access point: 57% of mid-sized firms are currently transitioning from manual monitoring to AI-based systems, per Gartner’s 2025 US AIOps tracking. The barrier is no longer technology availability or cost — it is organizational readiness and tool-selection confidence.
MSP market: AI as the core service layer
For Managed Service Providers specifically, the shift is structural. In 2024, over 60% of new managed-service contracts included AI-backed IT service tools, and automation-driven services (self-healing networks, proactive monitoring) surged 31% year-on-year. According to a 2025 MSP trend report, 58% of MSPs are now investing in operations automation as a key capability area. Firms using MSP-delivered managed services in 2024 reported a 27% decrease in system downtime and a 19% reduction in IT operation costs.
MTTR Benchmark: Automated Triage vs. Manual Dispatch
Mean Time to Resolve is the single most cited operational metric in AIOps ROI conversations — and the data is striking. Across multiple independent studies, the improvement range is narrow and consistent: 40–60% reduction in MTTR when automated incident detection, correlation, and triage replace manual processes.
Headline benchmark: A Forrester-commissioned study found that combining observability with AIOps reduces MTTR by up to 50% and increases availability of revenue-generating apps by 15%. Research Square’s peer-reviewed analysis of multiple AIOps deployments found a consistent 40% MTTR reduction across services and systems, alongside a 35% improvement in incident detection speed and a 25% improvement in problem-solving accuracy.
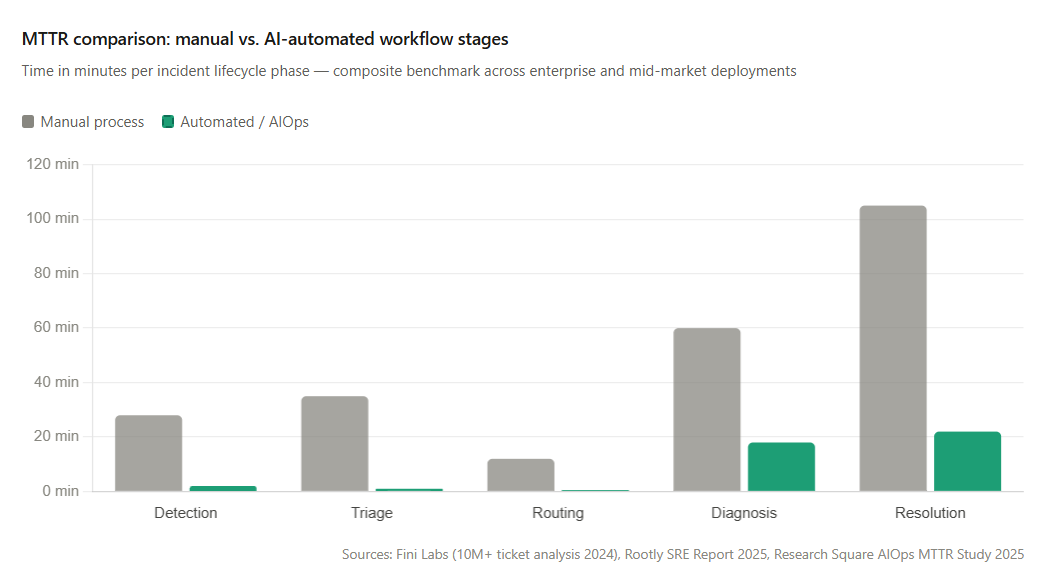
- Detection: 28 min manual → 2 min automated
- Triage: 35 min manual → 1 min automated
- Routing: 12 min manual → 0.5 min automated
- Diagnosis: 60 min manual → 18 min automated
- Resolution: 105 min manual → 22 min automated
Sources: Fini Labs (10M+ ticket analysis, 2024), Rootly SRE Report 2025, Research Square AIOps MTTR Study 2025.
Five documented benchmarks worth citing directly:
- BT Group case study: MTTR from 2 hours to 85 seconds. One of the most extreme documented examples — a 97% improvement through automated alert correlation and runbook-driven self-resolution.
- Microsoft Azure: 97% triage accuracy, 91% reduction in Time-to-Engage. Microsoft’s Triangle system achieved 97% triage accuracy in production, with a 91% reduction in the time it takes an engineer to engage with an incident.
- AI triage: under 1 second categorization vs. 3–8 minutes manually. Fini Labs’ analysis of 10M+ tickets across 150+ enterprise deployments found AI triage completes categorization in under 1 second and routing in under 2 seconds, versus 3–8 minutes and 5–12 minutes for human dispatchers — a 99% reduction.
- Rootly: AI-driven SRE cuts MTTR by 70%. Rootly’s 2025 benchmark found AI handles “the first 80% of incident response” — log aggregation, metric correlation, runbook surfacing — before human engineers engage.
- Uber’s Genie copilot: 13,000 engineering hours saved since September 2023. Translates to measurable headcount leverage without additional hires.
“AI incident agents now handle what incident.io calls the ‘first 80% of incident response’ — aggregating logs, metrics, and traces; identifying related changes; and surfacing relevant runbooks before engineers even engage.”
— Nitish Agarwal, Medium, January 2026 (synthesizing production data from Microsoft, Uber, Netflix deployments)
Cost Per Ticket: The Automation ROI Case
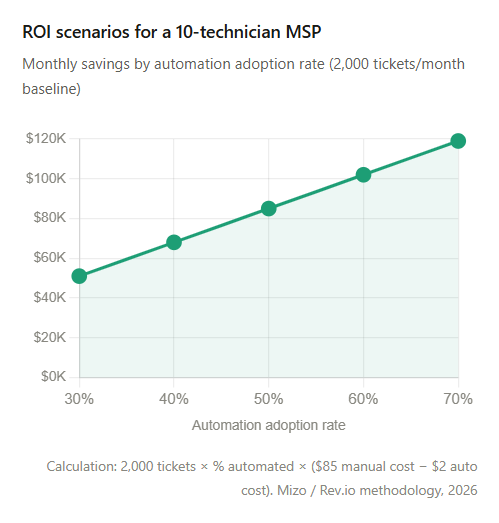
The cost delta between manually handled and automatically resolved tickets is the most direct line from AIOps investment to CFO-legible ROI. The data shows a 12x to 17x cost differential — and for high-volume MSPs, this is transformational math.
The baseline problem: Manual ticket handling costs MSPs an average of $85 per ticket for L1 work, rising to $75–$600 when tickets escalate through L2 and L3 tiers. 67% of MSP tickets are repetitive, low-value tasks. The average technician spends 40% of their day on ticket triage and administrative tasks alone — work that automation can absorb entirely.
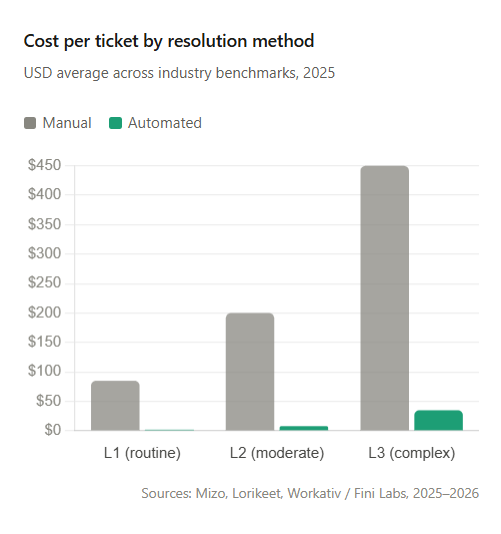
- L1: $85 manual → $2 automated
- L2: $200 manual → $8 automated
- L3: $450 manual → $35 automated
Sources: Mizo, Lorikeet, Workativ / Fini Labs, 2025–2026.
Industry benchmark — cost per ticket by sector:
| Industry segment | Manual cost/ticket | AI-automated cost | Potential saving | Automation fit |
|---|---|---|---|---|
| MSP / IT managed services (L1) | $85 avg | $1–$3 | $82–$84 | High |
| SaaS / software internal IT | $18–$35 | $2–$6 | $12–$29 | High |
| B2B enterprise IT support | $30–$60 | $3–$8 | $22–$52 | High |
| Telecom & utilities | $20–$30 | $2–$5 | $15–$25 | Moderate–high |
| L3 escalations (all sectors) | $75–$600 | $30–$60 (AI-assisted, not full auto) | Variable | Low (human required) |
The sharpest ROI is in L1 ticket automation — password resets, printer connectivity, disk space alerts, software access requests. These account for 67% of MSP ticket volume by typical count and require zero specialist knowledge. Fini Labs’ analysis found AI triage and resolution achieves 80% autonomous resolution rates in mature deployments, with first-year ROI ranging from 920% to 1,947%.
The AI chatbot vs. human cost comparison from Customer Experience Update data compiled by Fullview (2025) quantifies the core delta simply: AI interactions average $0.50 per resolution compared to $6.00 for human-handled interactions — a 12x difference at the per-contact level, before accounting for escalation, overtime, or error costs.
Human Error Reduction in Routine Network Maintenance
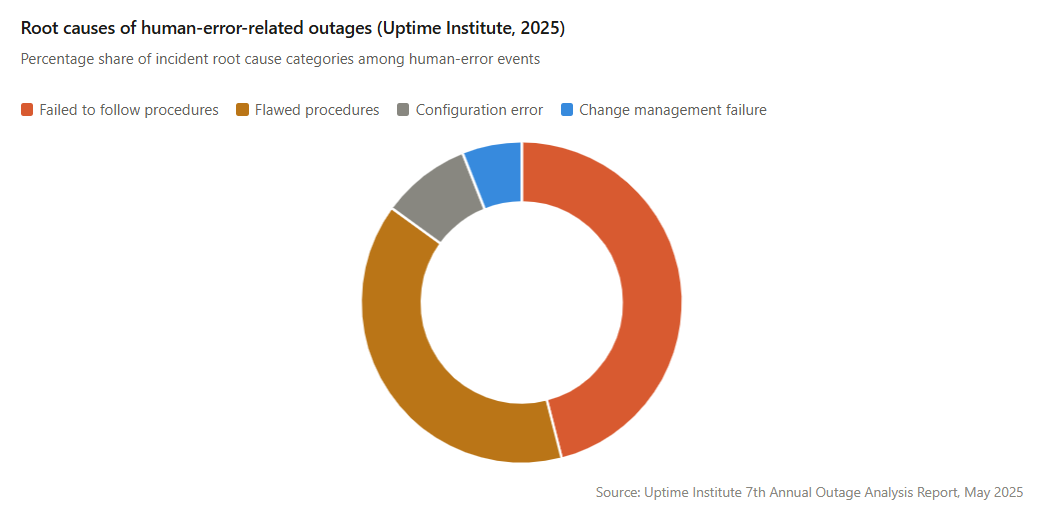
Human error is not a peripheral contributor to IT outages — it is the dominant one. The Uptime Institute’s 7th Annual Outage Analysis (2025) and Cisco’s 2025 networking research converge on the same conclusion: most outages are preventable, and automation is the most reliable mechanism for prevention.
The human error problem: Human error accounts for approximately 80% of all IT outages (Enconnex / CACI, 2025). Nearly 40% of organizations have suffered a major outage caused by human error over the past three years. Of those incidents, 85% stem from staff failing to follow procedures or from flaws in the procedures themselves. In 2025, the proportion of human error-related outages caused by failure to follow procedures rose by ten percentage points vs. 2024.
What automation addresses (estimated error reduction by category):
- Procedure compliance (runbook automation): eliminates ~85% of failure-to-follow errors
- Configuration management (IaC / automated drift detection): reduces config errors by 60–75%
- Patch and update automation (RMM-driven): eliminates manual patch scheduling errors (~90%)
- Change management guardrails (pre-flight checks): prevents the majority of unplanned change failures (~55%)
- Alert noise reduction (AI correlation): 80–90% alert suppression, reducing decision fatigue
Downtime cost context: The average cost of a single hour of downtime now exceeds $300,000 for over 90% of mid-size and large enterprises (ITIC Hourly Cost of Downtime Study). One in five major outages now costs over $1 million. With human error driving 80% of events, the financial case for automation is immediate.
Frequency reduction: Cisco’s 2025 networking research found 77% of organizations reported major outages over the last two years — with the global economic impact of a single severe disruption extrapolated to $160 billion. Network automation projects achieve ROI within two years in roughly half of deployments, per EMA Research.
The integration of AI into network automation is expected to grow at a 31.2% CAGR from 2025 to 2030, per Verified Market Reports — driven specifically by demand for predictive maintenance and real-time network optimization that removes human decision latency from routine maintenance windows.
Self-Healing Infrastructure: Outcomes & ROI Timelines
Self-healing infrastructure — where systems detect, diagnose, and remediate incidents autonomously without human intervention — is no longer a research concept. It is in production at a growing number of mid-market firms, with measurable outcome data now available from mature deployments.
Key stats:
- 65% incident resolution time reduction for AIOps self-healing adopters (NeuralWired / Deloitte, 2026)
- 9–14 months time to full ROI for SMEs adopting AIOps platforms (DataIntelo AIOps Data Centers Market, 2025)
- 73% of enterprises plan self-healing AIOps adoption by end of 2026 (Gartner Dec 2025 survey of 500+ IT leaders)
- 30% of enterprises projected to automate 50%+ of network ops by 2026 (Gartner, cited in Motadata, 2026)
AIOps maturity levels & corresponding outcomes
| Level | Stage | What it looks like |
|---|---|---|
| Level 1 | Monitoring | Centralized log/metric collection. No AI. High alert volume, all manual triage. |
| Level 2 | Alert correlation | AI deduplicates and groups alerts. 80–85% noise reduction. Still manual resolution. |
| Level 3 | Automated triage | ML-driven root cause analysis and routing. 40–50% MTTR reduction. Most MSPs target here. |
| Level 4 | Self-healing | Autonomous remediation via runbooks. 65%+ incident resolution reduction. 300% ROI in 18 months. |
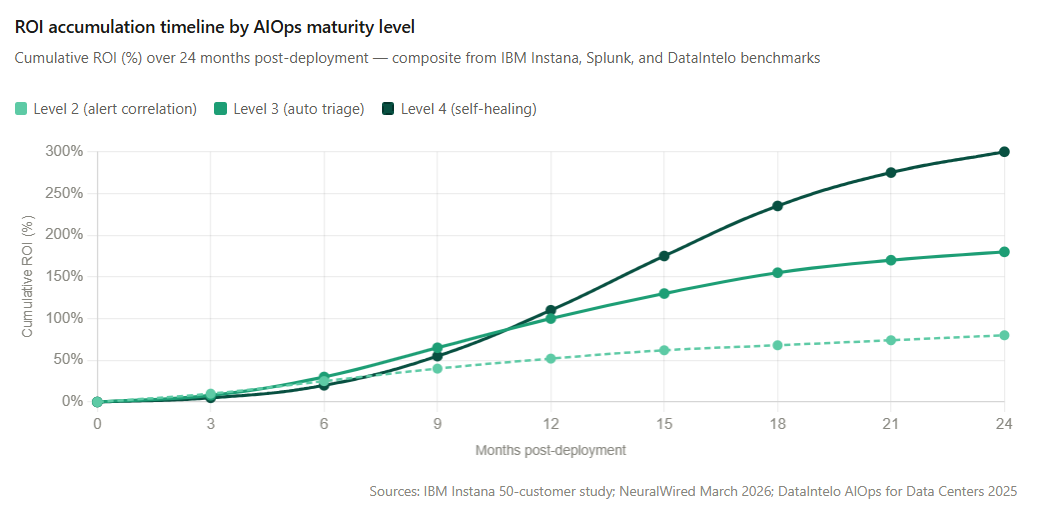
Caution — deployment failure rate: NeuralWired’s 2026 report notes that nearly one in three teams still fail at Level 4 rollout. The recommended approach: deploy in shadow mode for a minimum of two weeks — running autonomous remediation in parallel with production traffic, logging every action without executing it — before enabling live automation. Failures concentrate in misconfigured runbooks and insufficient training data, not technology limitations.
Adoption Maturity & Barriers for Mid-Market Firms
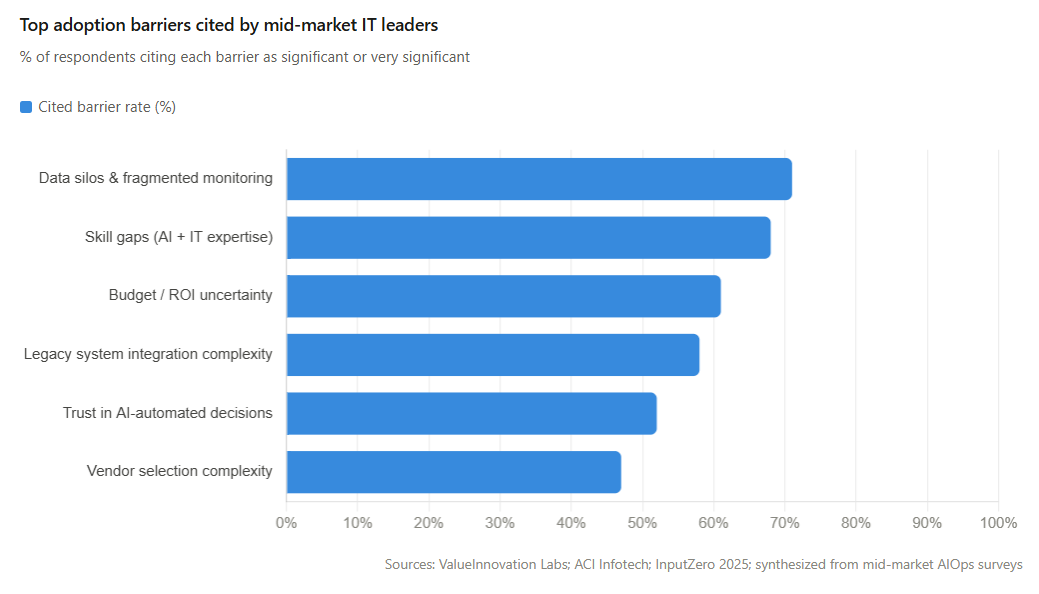
Understanding why 82% of mid-market enterprises have not deployed AIOps is as important as knowing the benefits. The barriers are structural and solvable — and the competitive window for early movers is narrowing.
What separates early movers from laggards
| Dimension | Laggards (below Level 1) | Early movers (Level 2–3) | Leaders (Level 4) |
|---|---|---|---|
| Ticket volume trend | Growing 3x over 5 years | Flat or declining | 40–70% below baseline |
| Technician utilization | 40% on triage/admin tasks | 15–25% on triage/admin | Under 10% on routine tasks |
| MTTR | 2–4+ hours | 45–90 minutes | Under 30 minutes |
| Alert fatigue | Severe — hundreds daily | Managed — correlated feeds | Minimal — only actionable |
| Hiring pressure | High — must hire to grow | Moderate — partial relief | Low — automation absorbs growth |
| SLA performance | Frequent breaches | Consistent compliance | Proactive: issues resolved pre-SLA |
The starting point that works: Industry guidance from InputZero, ValueInnovation Labs, and ACI Infotech consistently recommends the same entry sequence: start with a single high-volume use case (alert noise reduction or password reset automation), establish clean data governance before integration, and expand by maturity level. Most MSPs achieve Level 2 ROI within 6 months of a focused pilot.
Recommended action framework for mid-market IT leaders
- Baseline your current metrics before any deployment. Track MTTR, tickets per endpoint, repeat ticket rate, technician utilization, and cost per ticket. You cannot demonstrate ROI without a pre-automation baseline. Most ROI claims fail to land because this step was skipped.
- Select the highest-volume, lowest-complexity ticket category first. Password resets, disk space alerts, printer connectivity, and software access requests are the universal starting point — fully automatable, low-risk, and generating the fastest visible ROI.
- Clean and centralize your monitoring data first. AIOps platforms are only as good as their data inputs. Data silos and inconsistent naming conventions are the most common technical failure mode. Standardize before integrating AI correlation layers.
- Run autonomous actions in shadow mode before enabling live automation. For self-healing capabilities specifically, log every action the system would have taken for at least two weeks without executing it. Review with your on-call team. This prevents cascading failures from misconfigured runbooks.
- Reframe pricing and value delivery around outcomes, not headcount. By 2026, leading MSPs are shifting from per-device or per-hour billing to outcome-based contracts: “reduce downtime by X%,” “maintain 99.9% uptime.” Automation makes these commitments commercially viable — and differentiating.
All statistics sourced from publicly available Tier 1–3 research: Forrester, Research Square, Uptime Institute, Gartner, Mizo, DataIntelo, Rootly, Fini Labs, ITIC, Fortune Business Insights, and peer-reviewed AIOps studies (2025–2026 vintage).